NDepend - a honest review
August 25, 2017Once you start coding with C#, for hobby or work, in a while you need to write more professional code; is here that some productivity tools to write faster code using tools like ReSharper.
After each implementation, you need to analyze your code to make sure you aren’t duplicating any code, writing good OOP code, and writing small and maintainable methods.
Some weeks ago I was contacted via e-mail from NDepend team to give a try to the product.
In this review, I provide an my point of view on the static code analyzer NDepend.
Overview
NDepend is a static code analyzer extension for Visual Studio 2010, 2012, 2013, and 2015. It analyze your compiled code and showing statistics and patterns to improve your code base.
If you are thinking why you need another tool if you have ReSharper it’s for its goal. As developers we must have our toolbelt considering the right tool for many purposes. ReSharper puts its focus on offers suggestions during code editing at spec and method level.
NDepend looks at the solution as one unit, and makes suggestions based statically on the codebase analyzed.
NDepend is not ReSharper!! Check this post NDepend vs ReSharper showing the differences between the tools!
Installation
I received a zip file through e-mail and I have extracted the zip out to a folder (C:\NDepend).
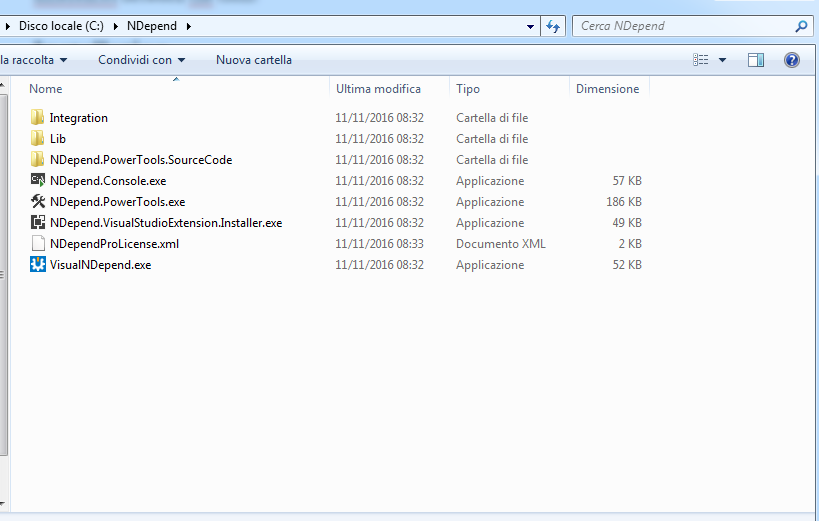
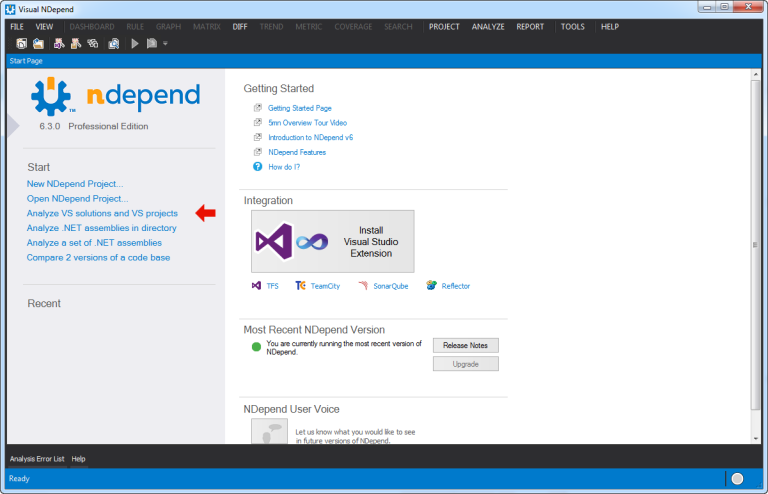
You can see an VisualNDepend.exe, it’s particularly usefull to analyze your solution. without to start Visual Studio.
Now we have to install the Visual Studio Extension, we can install it in two ways:
- run the Visual Studio Extension Installer NDpend.VisualStudioExtension.Installer.exe
- start VisualNDepend.exe and click "Install Visual Studio Extension"
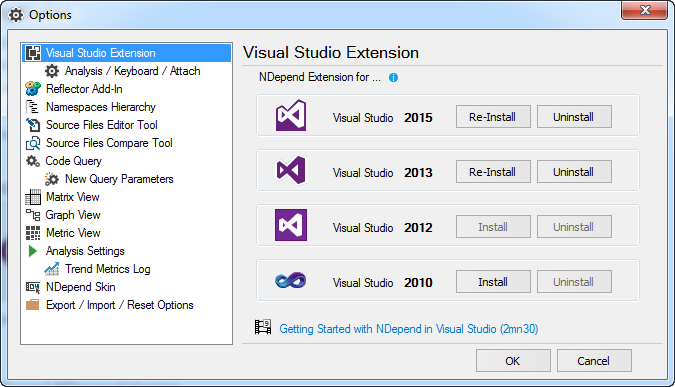
The Visual Studio Extension is available for the latest Visual Studio versions:
In order to use a registered version a NDependProLicense.xml file is required in the directory of NDepend “installation”. I have to give to NDepend support my contacts in order to build a license and get it via e-mail. Honestly I prefer a web portal to manage this kind of activities, but it’s not a big problem.
Now I can start Visual Studio 2015 and load one of my projects.
The first launch
Once I loaded my project, I noticed a new NDepend menu item in Visual Studio. I have two choices when using NDepend.
It’s possible to:
- Attach a new NDepend project to the current project or
- Attach an existing NDepend project to the current project
Since this is the first time I use NDepend, I chose the first option in order to build my first NDepend project.
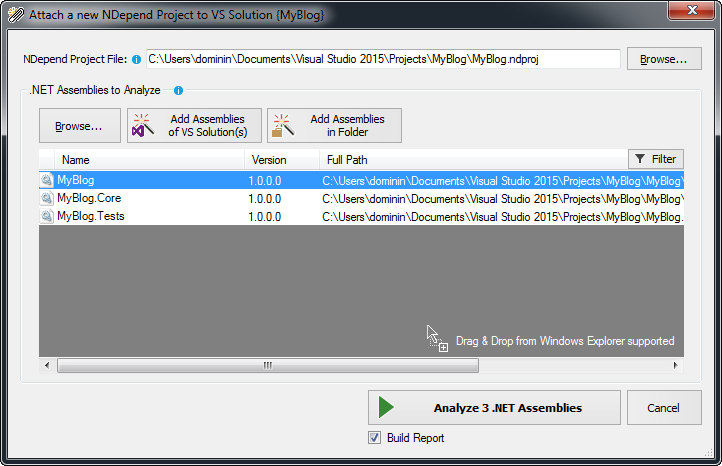
This new dialog give all the options required to start the code analysis, like the NDepend project location, the projects to analyze, and so on.
Once I click “Analyze” NDepend starts its job:
- all the projects are compiled
- it analyzes the code
- and, if the checkbox "Build a report" is clicked, a report is sent to the browser.
After the analysis is complete, the are the following options:
- View NDepend Dashboard
- Show NDepend Interactive Graph
- Browser NDepend Code Rules
- Close the dialog
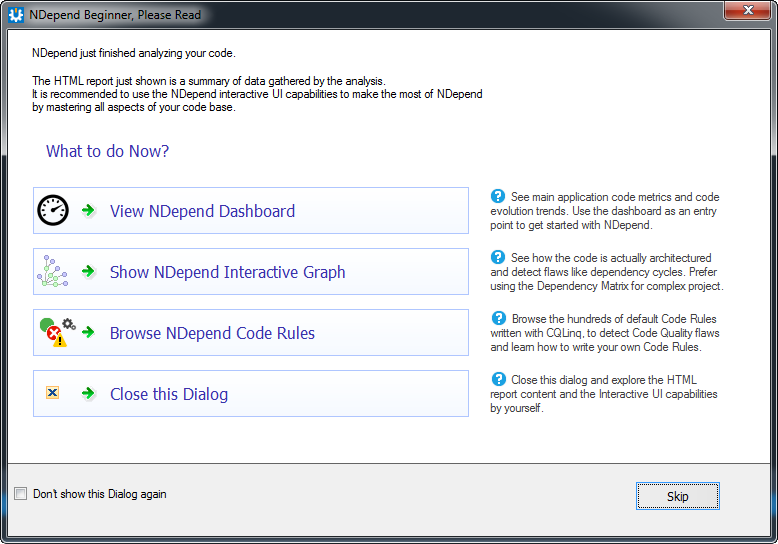
The analysis is pretty fast; and as a starter I decided to open the dashboard; and…I jaw-dropped on the huge amount of analytics produced by NDepend.
Below is an example of my project results:
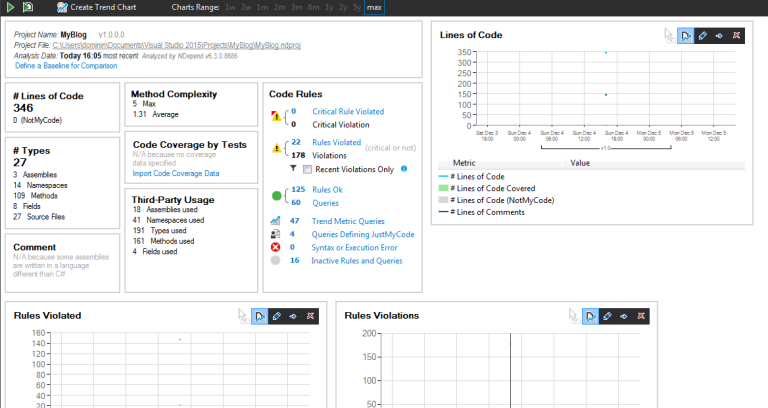
Let’s go more deeper in the analysis results.
I start from the first option in the Visual Studio NDepend menu, Rule then with Graph, Matrix, Trend and Metric.
NDepend features
Rule Explorer Panel
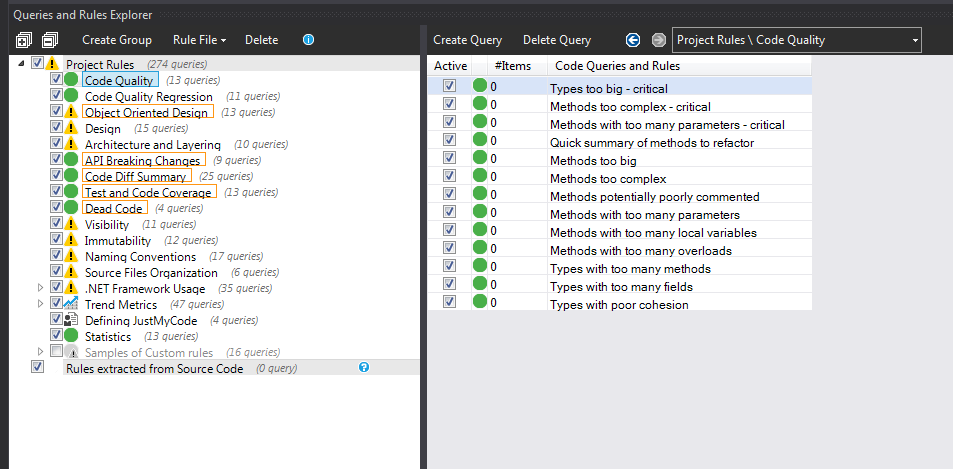 During the analyze of my project this is the most used panel, it shows to me the applied rules on the analysis and let me active/deactivate or alter rules and eventually write a new one.
Rule Edition Panel
With almost thousands of existing code metrics already available, it’s normally a good point to start the code analysis; in the last paragraph I pointed out that is possible to create a new rule or alter an existing one.
In my example a write a demo rule to detect all the application methods that are public and marked as Obsolete.
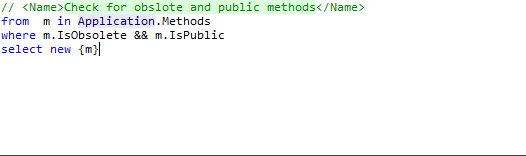
That’s probably the most powerful feature of NDepend with this pseudo language you can create your rules in order to apply your personal or business rules to the project and avoid rules violation.
NDepend team call this language Code Query for LINQ (CQLINQ); it uses all the “normal” Visual Studio language features (like Code Completion with IntelliSense, tooltip documentation) to write queries on your code base and check immediately the results.
CQLINQ is on the basis of all NDepend’s analysis, and honestly it alone worth the price of the product.
Dependency Graph
We now that each time that we add a reference or add new features the application grows, but can grow on complexity.
The dependencies graph provides an immediate and simple to read view of dependencies in your project, is not a simple report, but a complete and navigable application.
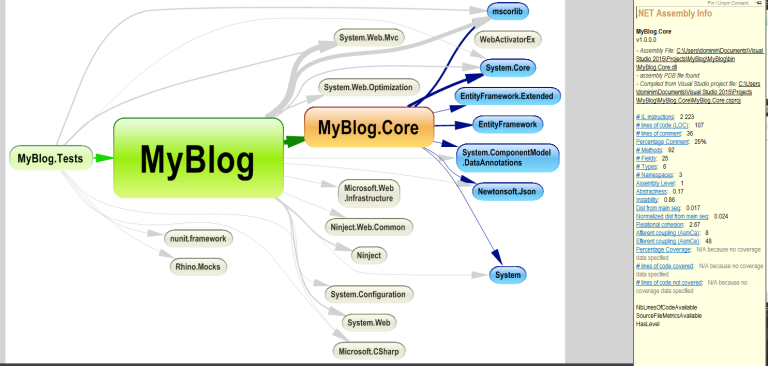
If you hover over a particular dependency, you will see the callers and callees of the pointed assembly.
Dependency Matrix
The dependency matrix is a tabular view of your code that analyze dependencies on a namespace, classes and properties.
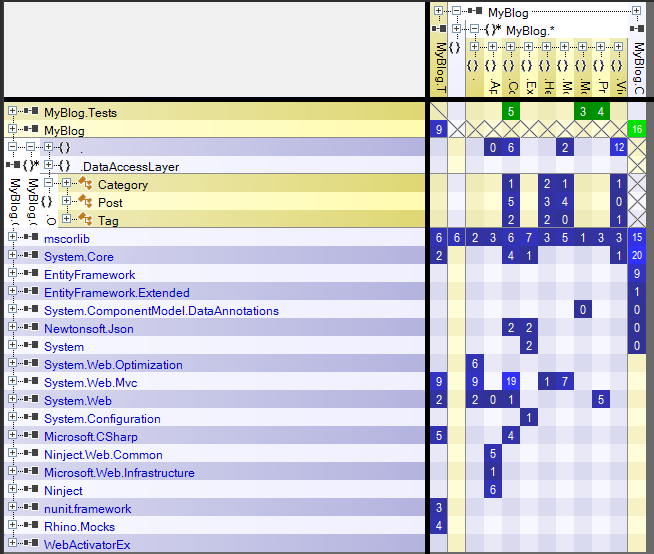
The idea is to identify when dependencies in a square turn black, it means that a number of namespaces are using “n” number of namespaces indirectly; the result can help you to identify the code that need a namespace refactoring.
At the moment I’m not proficient with this tool, I have to use it more!
Trend Charts
The trend charts are used from the dashboard, they provide a fast preview on how the project code quality is changing over time.
Sadly I haven’t a valuable image of this tool on my project :-(, I take the following from NDepend docs:
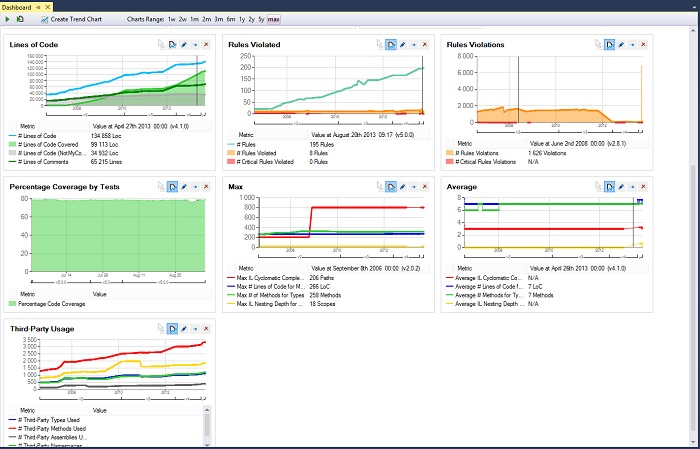
It’s required to use a baseline of your code in order to compare it with the current and get a new trend chart result; the result is pretty immediate.
If a good refactoring session occurs, probably (and hopefully) the Lines of Code trend chart will start to drop; as you can see there are a lot of charts out of the box, but since trend charts are query on your code is possible to build your own charts using CQLINQ!
These charts are immediate and really helpful on team projects; you can use it over time to check the quality of your product and check that is still compliant with your coding rules.
Metrics View
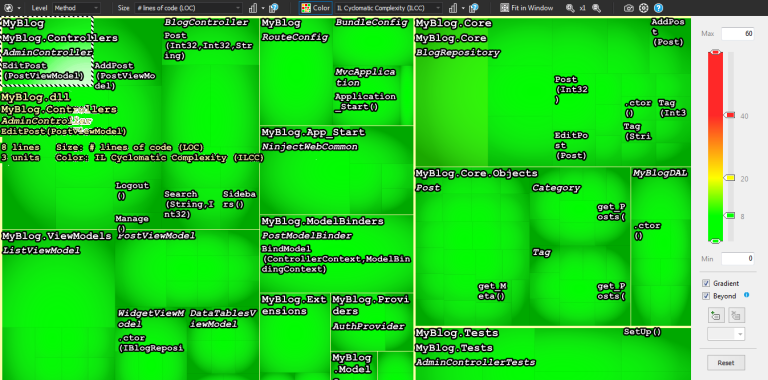
The metrics view is a stylish heatmap of the codebase based on a lot of different criteria.
For example the Lines Of Code selection at a method level can be used to instruct the heatmap to show the methods that are “too long” (eg longer then 25 lines of code!) and consequently less maintainable.
Conclusion
That’s are the views that I have used, I must to say that was a great experience and all the tools are greatly integrated together.
I have used NDepend for two weeks, I can say that the views I’m using the most are the Dashboard, Rules Explorer and Code Metrics View, but I have to become more experienced on other views.
IMHO NDepend is not for junior software devs, you must be experienced and know what the tool is talking about; if correctly instrumented and inserted in the production lifecycle can be a game-changer.
Honestly I don’t like the setup (unzip manually in a folder), but I don’t know if I have to install in this way because of my review.
I truly recommend this tool.